
Great infographics about bicycling
Who doesn’t love to play? Let’s start a game today and enjoy the work of our friends who put many hours into creating and designing infographics about bicycles.
The rules of the game:
I presented here 5 infographics that will enter the contest. You will have to grade each of them from 1-10 (10 being the best) according to the next criteria:
- creative
- utility of the data
- funny
- interesting point being underlined
- things I didn’t know
- suggestivity of the design
- easy to be understood
- something important to be learnt
- memorable
- clarity of the content
The infographic that will win the most points will be the winner of the contest and will be shared on our FB page.
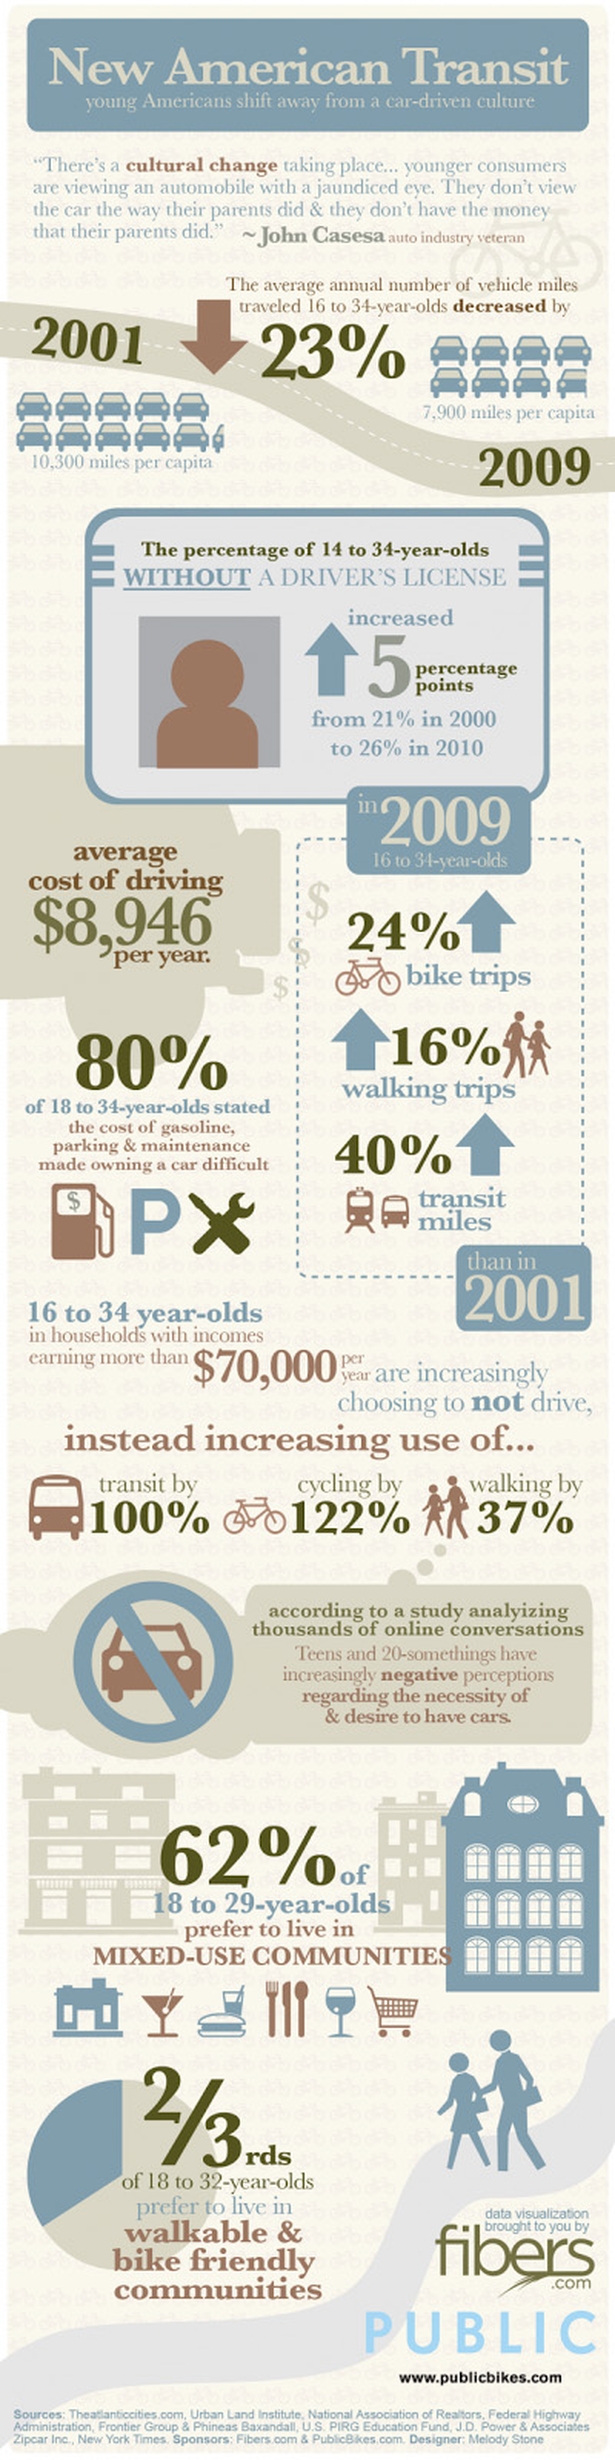
1. Infographic no1:
New American Transit Young Americans shift away from a car-driven culture.
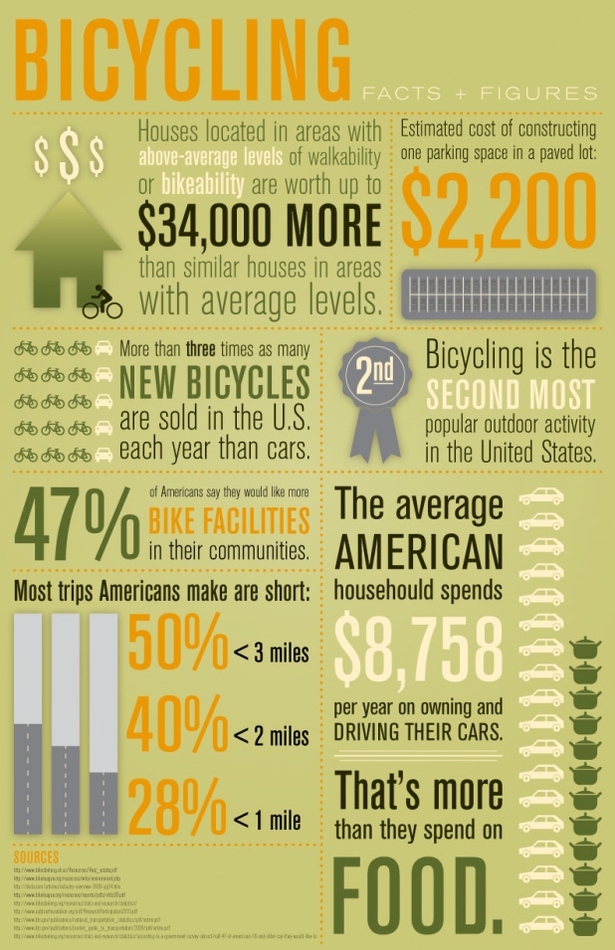
2. Infographic no2:
Bicycling in US presents some fact and numbers about the very desirable sport.
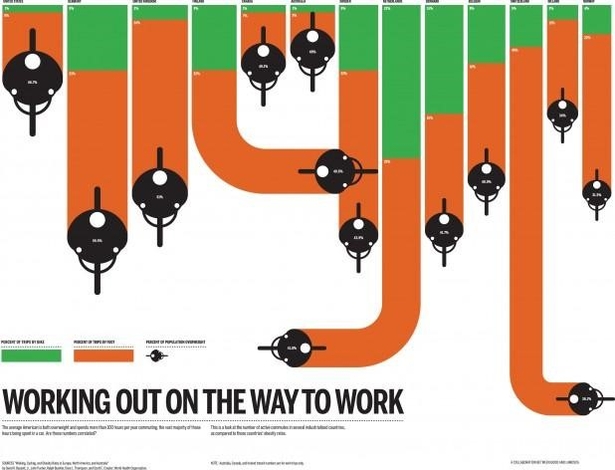
3. Infographic no3:
Working out on the Way to Work shows the correlation between bike commuters and obesity rates in different
countries around the world.
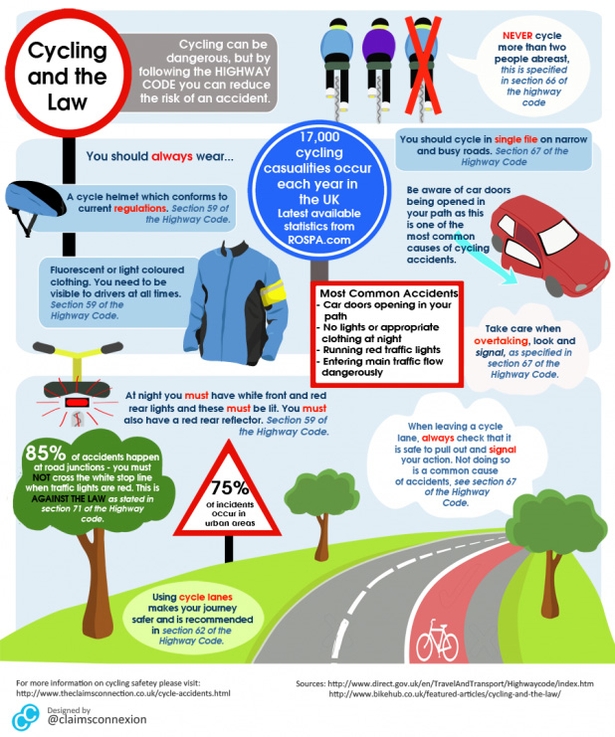
4. Infographic no4:
Cycling and the Law presents the most important laws when you are bicycling in the UK. Take a look and get informed.
But do not forget about the way of the road they are using ;-)
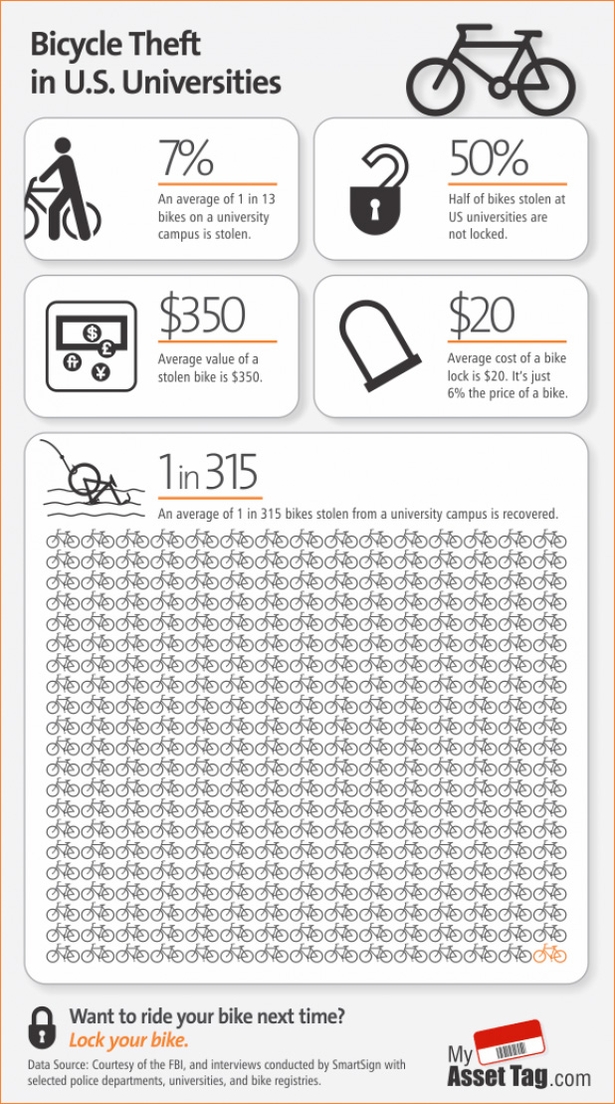
5. Infographic no5:
The safety of your bike is also important. Make sure you have a proper lock and watch out for quick release mechanisms if you lock up in bad areas.
Bicycle theft at US Universities is especially common, so be smart if you lock up on a campus. Here
are a few things to pay attention to.
Now, all these being presented, we are looking forward to read your grading and then to present the winner.
And, don’t forget, surround yourself with beauty, safety and happiness, and get out and ride!
Credit: http://blog.visual.ly/celebrate-independence-with-these-17-infographics-about-bicycling
If you already have an account, please LOGIN.
If not, you may consider creating on. It’s FREE!
» Login
» Sign up